
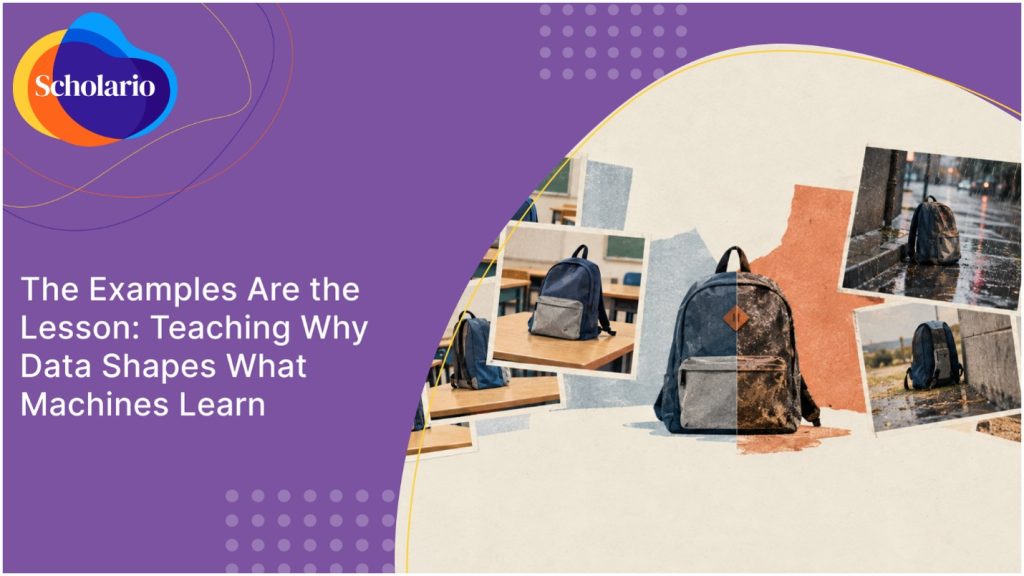
Picture a class that trains an image classifier to recognise “school bag.” Every photo comes from their own classroom, in daytime, on a desk. It works well in class. Then a student shows it a bag on a rainy street, and it has no idea.
Nothing is wrong with the software. It did what it was taught. The problem is what it was shown. (This is an imagined class, but any teacher who has run a first classifier will recognise it.)
The idea underneath most of machine learning
A machine learning model has no opinions and no common sense. It has patterns from its examples. That is why “how machines learn” is really a lesson about data, and students can understand it early.
They usually arrive with a simple belief: more data means a better model. That is only half true. Three questions matter more than the count.
| Question | What it means | What goes wrong |
| Enough? | Are there enough examples of each thing? | The model is unsure about anything rare |
| Balanced? | Does one type dominate? | It gets good at the common case and poor at the rest |
| Labelled well? | Is each example named correctly? | The model learns the mistake |
This table is our teaching frame, not a quoted source. More of the same one-sided data does not fix a one-sided model, and students can see this for themselves by changing the examples.
From “the AI is biased” to “here is why”
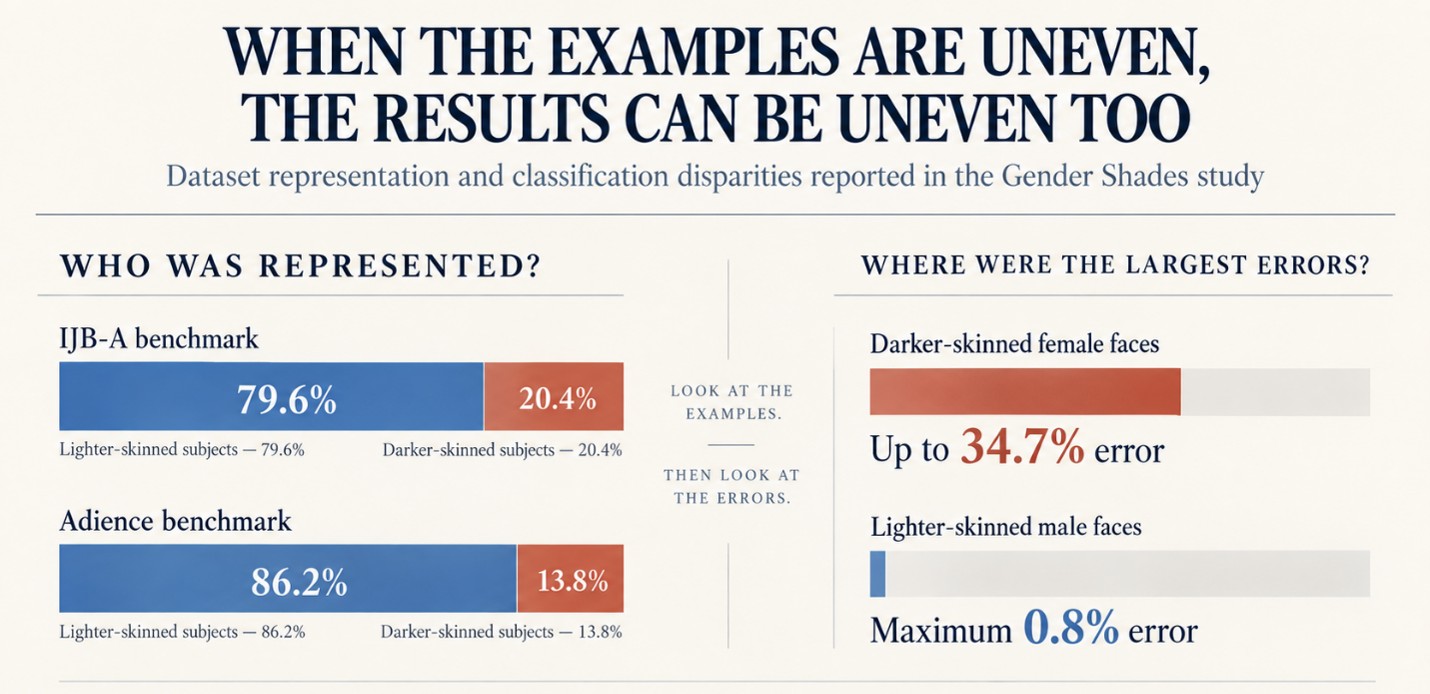
A student who says “the AI is biased” has noticed something real, but has not yet learned anything they can act on. A student who says “the model rarely saw examples like this” has a cause and can suggest a fix.
That shift, from complaint to cause, links directly to bias in data. Cause-finding also needs a way to measure errors, which is where what a confusion matrix reveals comes in.
Something to think about:
If students can say a model is biased but cannot point to which examples caused it, what have they actually learned?
What leaders can ask to see
Ask to see a lesson where students change the data and watch the behaviour change. Add examples, remove some, fix a label. If students only read about training data, they have a definition. If they alter it and see the result, they have an understanding.
Also ask where the idea returns. A one-off “data” lesson is quickly forgotten. It matters when the same idea comes back later at greater depth, for instance when students meet small neural network models or computer vision.
Where Scholario APEX AI returns to the same idea
Scholario APEX AI treats “Data & Learning” as one of five threads that run through the programme, so students meet training data more than once. The curriculum documents describe how the idea travels:
| Grade | What students do with data |
| KG2 | Learn that AI finds patterns by seeing many examples |
| Grade 2 | Learn training data and labels; look at what happens when data is too small or one-sided; when the robot gets it wrong, Olivia checks her training data to find out why |
| Grade 4 | Trace unfairness back to the examples a model was shown, using real cases (facial recognition, loan approval, content recommendation) |
| Grade 5 | Work with features and labels, training/validation/test splits and overfitting; a skewed face-recognition training set is a worked case |
| Grade 9 | Prepare datasets (augmentation, class balance) and fine-tune a MobileNet on a 60-image dataset |
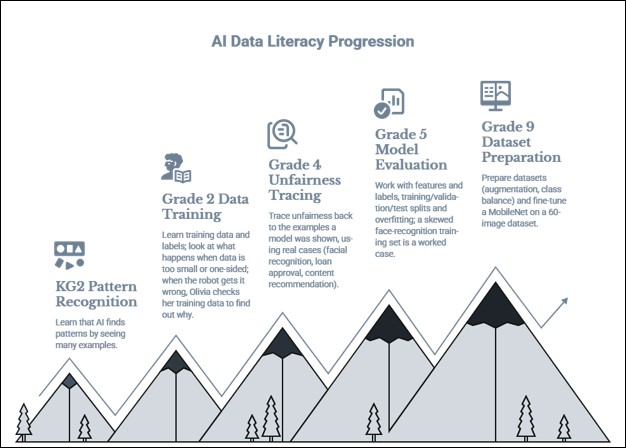
Digital activities include Labelled Data Sorting (Grade 2), Data Split Activity (Grade 5), and Dataset Balance Checker and Dataset Augmentation Activity (Grade 9). The documents say a student who meets training data as a story in Grade 2 meets it again in Grade 9 as class balance and augmentation. See how the learning journey develops across the thread. For the younger end, see primary AI understanding.
FAQs
Does more data always fix bias?
No, not by itself. If the extra examples are just as one-sided, the model stays one-sided. What matters is which examples are added. Grade 2 teaches this directly through the question of what happens when data is too small or one-sided.
Do students need to code?
No. According to the APEX documents, Kindergarten to Grade 4 is unplugged or browser-based, and Grade 5 uses no-code Teachable Machine, where students collect data, train, test and read an accuracy figure.
How young can we start?
KG2 introduces the first intuition: the more pictures the robot sees, the better it learns. Grade 2 makes training data and labels explicit.
How do we know students have understood?
A stated Grade 2 outcome is that students can identify one reason a model might fail. In Grade 5, students calculate accuracy from a confusion matrix and explain overfitting in their own words.