
A weather model is tested on 100 days of data. It gets 90 of them right. Most people would call that a good model.
Now add one detail. It rained on only 10 of those days, and the model predicted “no rain” every single time. It never caught a rainy day. It still scored 90%.
That is how most people, adults included, judge AI systems. We look at one number. The number looks healthy. We move on.
A confusion matrix is the tool that stops us from moving on too quickly. It is a small table, only four cells in its simplest form, and it may be one of the most useful ideas a school can teach about AI. It is not advanced mathematics. What makes it powerful is that it changes the question students ask. “Is it accurate?” becomes “How is it wrong, and who pays for that?”
Why AI model evaluation belongs in the curriculum
Students meet AI decisions every day. A filter decides which email is spam. A platform decides which video to show next. A phone decides whether a face matches its owner. Each of these is a classification: the system sorts an input into a category.
Many school AI programmes spend most of their time on what AI can do. Far fewer teach students how to judge whether it did it well. That is a real gap, because evaluation is where understanding shows. International frameworks point in this direction too. UNESCO’s AI competency framework for students places strong weight on critical judgement of AI solutions and on students’ responsibilities as citizens in the era of AI. Judgement needs a method, and the confusion matrix is one of the simplest methods available. (INEE)
For curriculum leaders, this is also a useful test of any AI programme. Does it teach students to question a model’s results, or only to use the model? The answer tells you whether the programme treats students as operators or as thinkers.
What the four boxes actually say
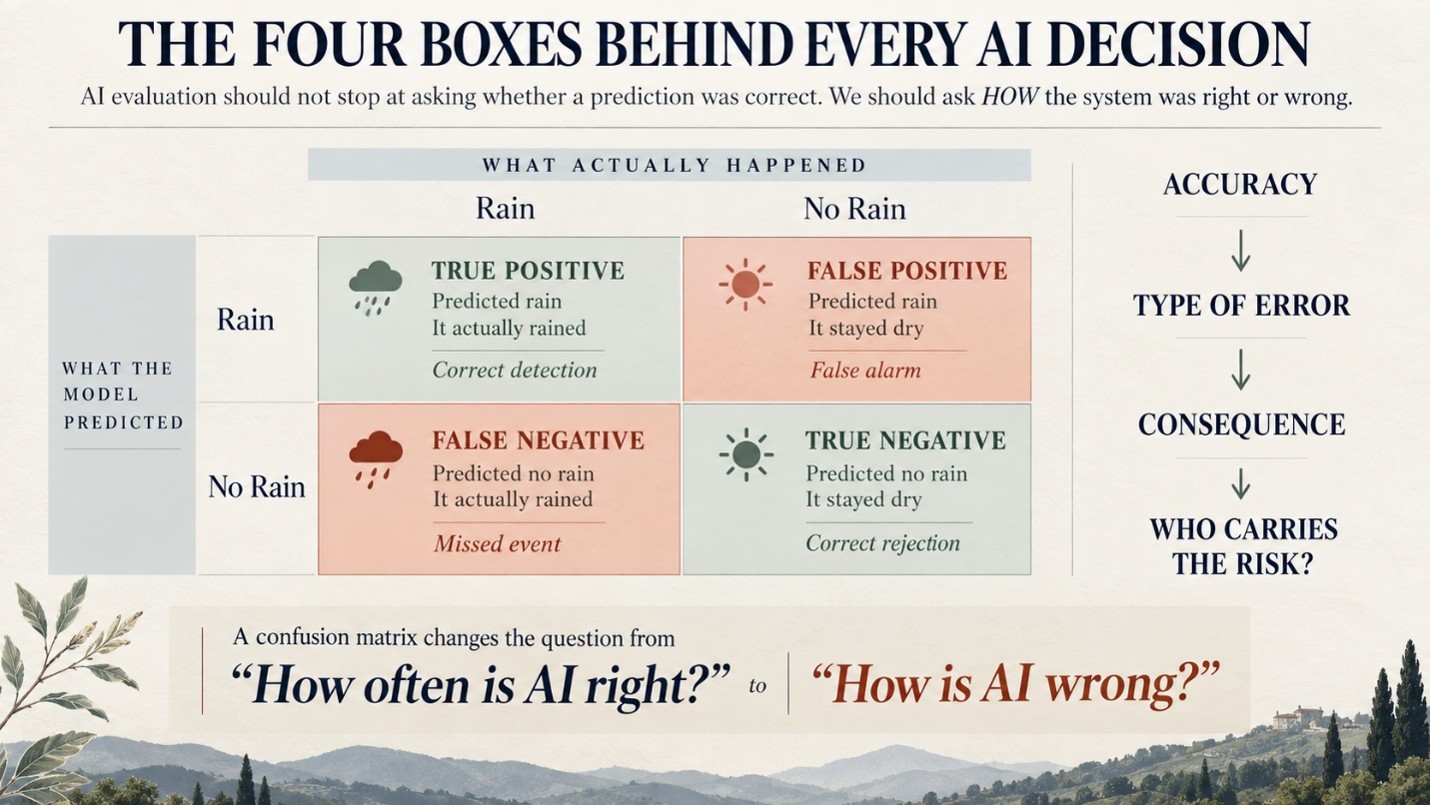
A classifier makes a prediction. Later, we find out what really happened. Put those two facts side by side and only four outcomes are possible.
| Outcome | What it means | Rain-prediction example |
| True positive | The model said “yes” and the answer was yes | Predicted rain, and it rained |
| False positive | The model said “yes” but the answer was no | Predicted rain, but it stayed dry (a false alarm) |
| False negative | The model said “no” but the answer was yes | Predicted dry, but it rained (a miss) |
| True negative | The model said “no” and the answer was no | Predicted dry, and it stayed dry |
Nothing here needs more than counting. That is exactly why it works with younger students. A ten-year-old can sort results into four boxes. What they learn from doing so is surprisingly deep.
Why accuracy alone can mislead
Go back to the weather example. Here are two models tested on the same 100 days, with 10 rainy days.(illustrative)
| Measure | Model A: always says “no rain” | Model B: tries to predict rain |
| True positives | 0 | 8 |
| False positives | 0 | 7 |
| False negatives | 10 | 2 |
| True negatives | 90 | 83 |
| Accuracy (correct ÷ all) | 90% | 91% |
| Precision (correct “rain” ÷ all “rain” predictions) | Not defined (never predicts rain) | 53% |
| Recall (rainy days caught ÷ all rainy days) | 0% | 80% |
The accuracy scores are almost identical. The usefulness is completely different. Model A has learned nothing about rain. Model B catches most rainy days but raises some false alarms.
This happens whenever the thing we care about is rare. Fraud, disease, defects in a factory and dangerous content online are all rare compared with normal cases. A model can score very well on accuracy simply by always predicting “normal.” Students who understand the four boxes can spot this trap. Students who only see the accuracy figure cannot.
Errors are not equal, and that is where ethics begins
Once students can see the two kinds of error separately, a better question appears: which error matters more?
In a medical screening tool, a false negative means someone who is ill is told they are fine. A false positive means a healthy person gets a worrying result and an extra test. In a spam filter, the worse error is usually the false positive, because an important message disappears. In industrial safety inspection, missing a real crack in a pipeline may be far more serious than stopping work for a crack that was not there.
Most models can be adjusted to reduce one kind of error, but usually at the cost of increasing the other. So choosing where to set that balance is a value judgement. It is a decision about who carries the risk. That makes the confusion matrix one of the most natural bridges between technical AI learning and.
The same tool also exposes unfairness. A single overall score can hide very different results for different groups of people. In the well-known Gender Shades study, researchers tested three commercial gender classification systems and found that darker-skinned women were misclassified most often, with error rates reaching 34.7%, while the highest error rate for lighter-skinned men was 0.8%. One headline accuracy figure would never have shown that gap. Splitting the results by group, in effect building a confusion matrix for each group, is what makes it visible. (mlr)
This leads to a question every curriculum leader should consider:
If a student can report a model’s accuracy but cannot say who carries the cost of its mistakes, what exactly have they learned about AI?
How the idea can grow from primary to secondary
A confusion matrix is not a one-lesson topic. The underlying idea, “check how the model got things wrong,” can return at every stage with more depth. The progression below is our recommendation, not an official standard.
| Stage | What students do | The question they learn to ask |
| Early primary | Sort objects using a simple rule, then check which ones the rule got wrong | “Which ones did it get wrong?” |
| Upper primary | Count results into a 2×2 table and calculate accuracy | “How often was it right?” |
| Lower secondary | Compare precision and recall; test models on data where one outcome is rare | “What kind of wrong is it?” |
| Upper secondary | Adjust decision thresholds, weigh the cost of each error, compare results across groups | “Who pays for the errors, and who should decide?” |
Notice how the mathematics grows slowly while the reasoning grows quickly. By the end, students are not only calculating. They are arguing about deployment decisions. That is what looks like in practice for one idea.
What curriculum leaders should look for
When reviewing an AI programme, look closely at how it handles evaluation. A few questions will tell you a lot.
First, do students evaluate models they have built themselves, or only use finished tools? Testing your own model makes errors personal and memorable.
Second, do students calculate the results, or are they only shown a finished chart? Calculation builds understanding; watching builds familiarity.
Third, are errors connected to consequences and to people? If evaluation stays purely numerical, students miss the point of it.
Finally, does evaluation come back in later years at greater depth? If it appears once and disappears, it is an activity, not a thread. The same principle applies to assessment design more broadly, which is explored in.
A second question is worth sitting with: